Flag Patterns: The Secret to Building Quick Wealth in Financial Markets Help of Bullish or Bearish Chart Patterns
Table of Contents
Introduction
- Definition of a flag pattern
- Purpose of using flag patterns in trading
When it comes to technical analysis in trading, flag patterns have become a popular tool for traders to identify potential trading opportunities. A flag pattern is a chart pattern that forms after a significant price move, indicating a continuation of a trend in the price action of a financial asset. In this article, we will delve into the anatomy of a flag pattern, how it works, and various trading strategies traders can use to make informed trading decisions.

Anatomy of a Flag Pattern
- The flagpole
- How to identify a flag pattern on a chart
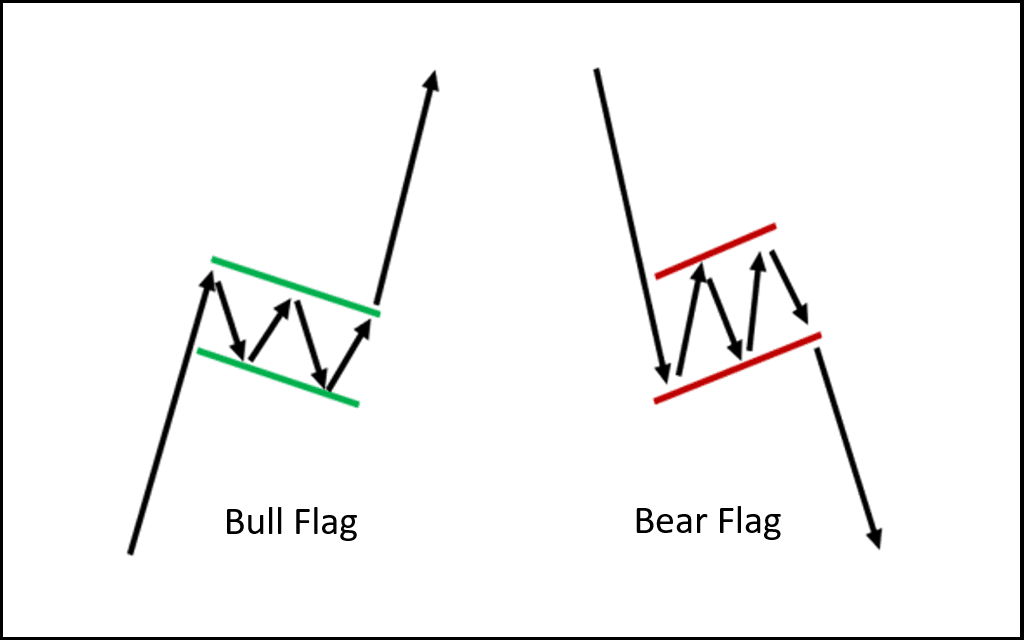
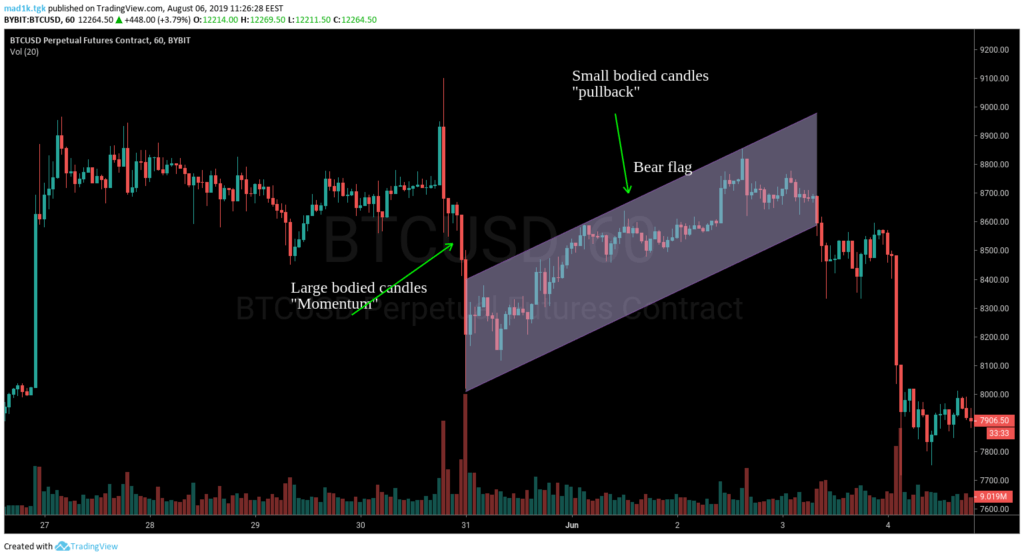
The flag pattern comprises two main parts: the flagpole and the flag. The flagpole is the sharp and significant price move that precedes the flag. The flag, on the other hand, is the consolidation period that follows the flagpole. During this period, the price typically moves sideways in a narrow range, forming a rectangular or parallelogram shape on the chart. To identify a flag pattern, traders look for a significant price move, followed by a period of consolidation.
How Flag Patterns Work
- The psychology behind the formation of a flag pattern
- How traders use flag patterns to identify trading opportunities
- Bullish and bearish flag patterns and their respective breakouts
Traders can use flag patterns to identify potential trading opportunities and make informed trading decisions. One of the most common trading strategies is to set buy or sell orders at the breakout point, with a stop-loss order placed slightly below or above the flag pattern’s lower or upper trendline to manage the risk of the trade. Traders can also use other technical indicators in conjunction with flag patterns to confirm their trades.

Trading Strategies Using Flag Patterns
- Setting buy and sell orders at the breakout point
- Placing stop-loss orders
- Using other technical indicators in conjunction with flag patterns
While flag patterns can be a useful tool in technical analysis, they are not a foolproof trading strategy. Traders should always exercise caution and use other analysis tools to confirm their trades before entering the market. It’s also essential to consider trading volume when analyzing a flag pattern. A significant increase in volume during the consolidation period and a breakout can confirm the pattern’s validity and increase the likelihood of a continuation of the trend. Furthermore, if the price breaks out in the opposite direction of the previous trend, it could signal a trend reversal.
Limitations of Flag Patterns
- Not a foolproof trading strategy
- Importance of considering trading volume
- Potential for trend reversals
Flag patterns are a useful tool for traders to identify potential trading opportunities and make informed trading decisions. By understanding the anatomy of a flag pattern, traders can identify and trade this pattern to their advantage. However, traders should keep in mind the limitations of flag patterns and use them in conjunction with other technical analysis tools to confirm their trades.
Conclusion
- Summary of key points
- Importance of using flag patterns in trading
- Closing thoughts and recommendations
In conclusion, flag patterns are widely used in forex, stocks, and other financial markets by both beginner and experienced traders. It’s a valuable tool for identifying potential trading opportunities and making informed trading decisions. With practice and experience, traders can master the use of flag patterns in their trading strategy and potentially achieve profitable outcomes.
How to Take a Successful Trade on a Flag Pattern

- First, identify the flag pattern on the chart. The pattern is characterized by a sharp and significant price move, followed by a consolidation period where the price moves sideways in a narrow range, forming a rectangular or parallelogram shape on the chart.
- Determine the direction of the prevailing trend. The flag pattern is a continuation pattern, so traders should look for a breakout in the direction of the previous trend.
- Look for a breakout from the consolidation period. This occurs when the price moves above the upper trendline in a bullish flag pattern or below the lower trendline in a bearish flag pattern.
- Set a buy or sell order at the breakout point. Traders may use various methods to determine the entry point, including placing the order slightly above or below the breakout point or waiting for a confirmation candlestick pattern.
- Place a stop-loss order to manage the risk of the trade. This can be set slightly below or above the flag pattern’s lower or upper trendline, depending on the direction of the trade.
- Set a profit target. Traders may use various methods to measure the flagpole’s length to set a price target for the continuation of the trend.
- Monitor the trade and adjust the stop-loss and profit target as necessary. Traders may choose to move the stop-loss to break-even or adjust the profit target based on the price action.
- Remember that the flag pattern is not a foolproof trading strategy, and traders should always exercise caution and use other analysis tools to confirm their trades before entering the market.
- Consider the trading volume during the consolidation period and breakout to confirm the pattern’s validity and increase the likelihood of a continuation of the trend.

By following these key points, traders can use the flag pattern to identify potential trading opportunities and make informed trading decisions. It’s important to remember that the flag pattern is just one tool in a trader’s toolbox and should be used in conjunction with other analysis methods for the best results.
FAQ’s
How long do flag patterns typically last?
The duration of the flag pattern can vary, but it is generally shorter than the preceding flagpole. Traders may use various methods to measure the flagpole’s length to set price targets for the continuation of the trend.
Can flag patterns guarantee profitable trades?
No, flag patterns are not a foolproof trading strategy, and traders should always exercise caution and use other analysis tools to confirm their trades before entering the market. Traders should also consider the trading volume and potential for trend reversals before making trading decisions.
Are flag patterns the only technical analysis tool traders use to make trading decisions?
No, flag patterns are just one of many technical analysis tools that traders use to analyze financial markets. Traders typically use a combination of technical indicators and analysis methods to make informed trading decisions.


